In today’s data-driven world, efficient data monitoring and analysis are crucial for business success. At aiblux, we specialize in providing custom, data-driven enterprise solutions. Our expertise includes leveraging powerful tools like the Grafana LGTM Stack to deliver unparalleled insights. This guide will walk you through the essentials of the Grafana LGTM Stack, helping you understand its components and how it can benefit your organization.
1. Introduction to Grafana LGTM Stack
The Grafana LGTM Stack consists of four key components: Loki, Grafana, Tempo, and Mimir. Each component plays a vital role in data monitoring and analysis.
- Loki: Efficient log aggregation system indexing labels, not contents.
- Grafana: Visualization platform for metrics, logs, and traces.
- Tempo: Distributed tracing backend for tracking request flows.
- Mimir: Scalable time-series database for metrics storage and querying.

2. Setting Up Loki for Log Aggregation
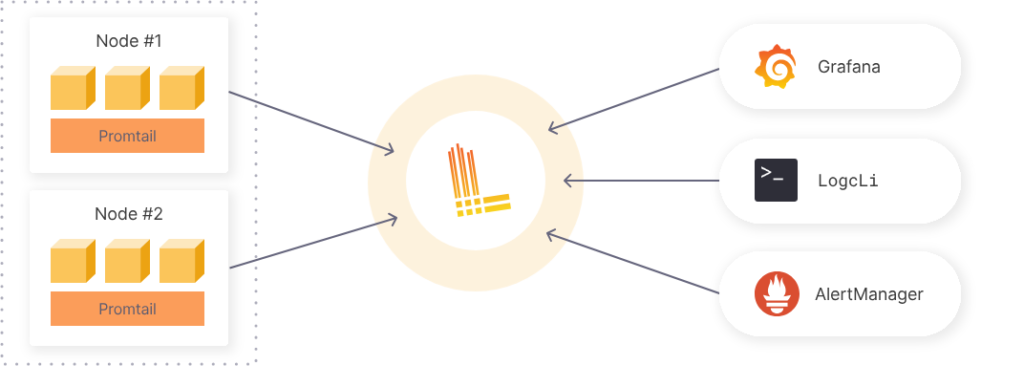
Loki is a log aggregation system designed to store and query logs efficiently. Setting up Loki involves configuring the Loki server and integrating it with your log-producing applications.
Steps:
- Download Loki: Obtain the Loki binary from the official Grafana Loki repository.
- Install Loki: Follow the installation instructions specific to your operating system.
- Configure Loki: Set up the
loki-config.yamlfile to define how Loki will receive and process logs. - Run Loki: Start the Loki service and ensure it is running correctly.
3. Configuring Grafana for Data Visualization
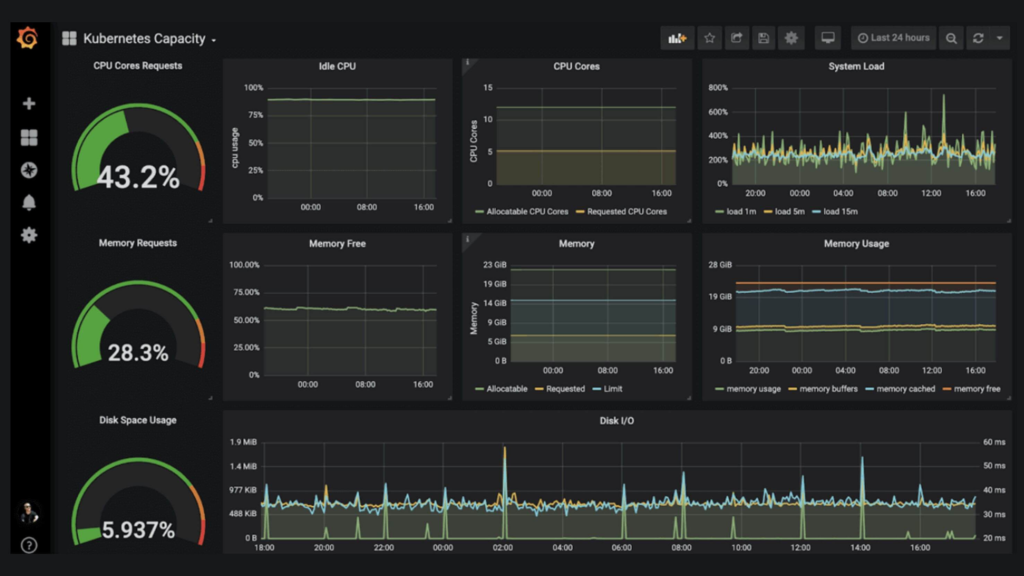
Grafana is the visualization layer of the stack. It allows you to create, explore, and share dashboards. Configuring Grafana involves connecting it to Loki, Tempo, and Mimir, and setting up dashboards for different data sources.
Steps:
- Install Grafana: Download and install Grafana from the official Grafana website.
- Add Data Sources: In Grafana, navigate to Configuration > Data Sources and add Loki, Tempo, and Mimir as data sources.
- Create Dashboards: Build custom dashboards by adding panels and queries that visualize your data.
- Set Alerts: Configure alerts to monitor key metrics and get notified of any issues.
4. Integrating Tempo for Tracing
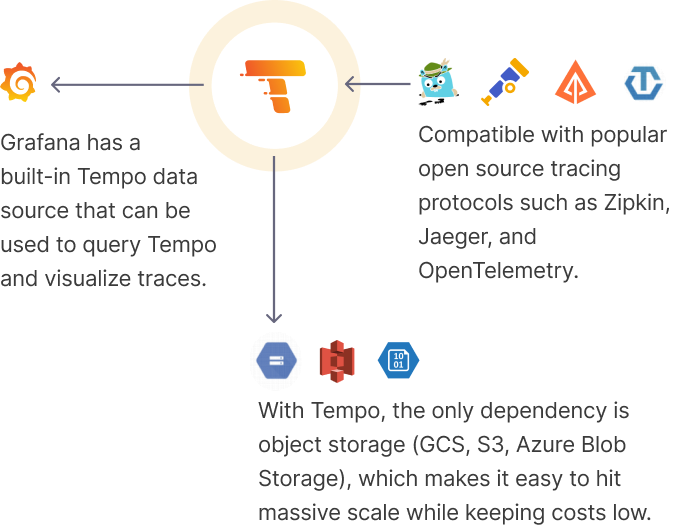
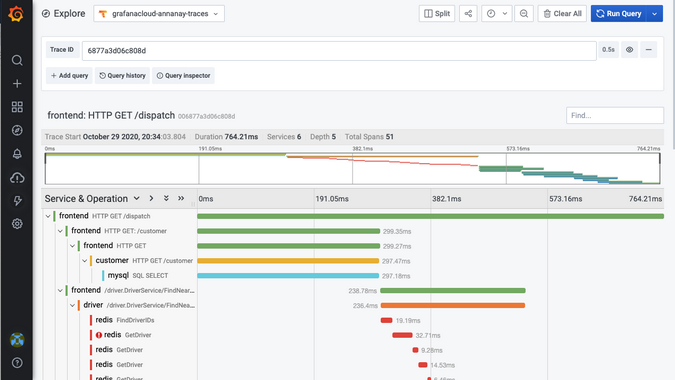
Tempo is used for tracing and helps in tracking the flow of requests through various services. Integrating Tempo involves setting up Tempo server and configuring it to collect trace data from your applications.
Steps:
- Install Tempo: Follow the installation guide on the Grafana Tempo website to set up Tempo.
- Configure Tracing: Modify your application to send trace data to the Tempo server using compatible tracing libraries.
- Integrate with Grafana: Add Tempo as a data source in Grafana and create panels to visualize trace data.
5. Utilizing Mimir for Metrics
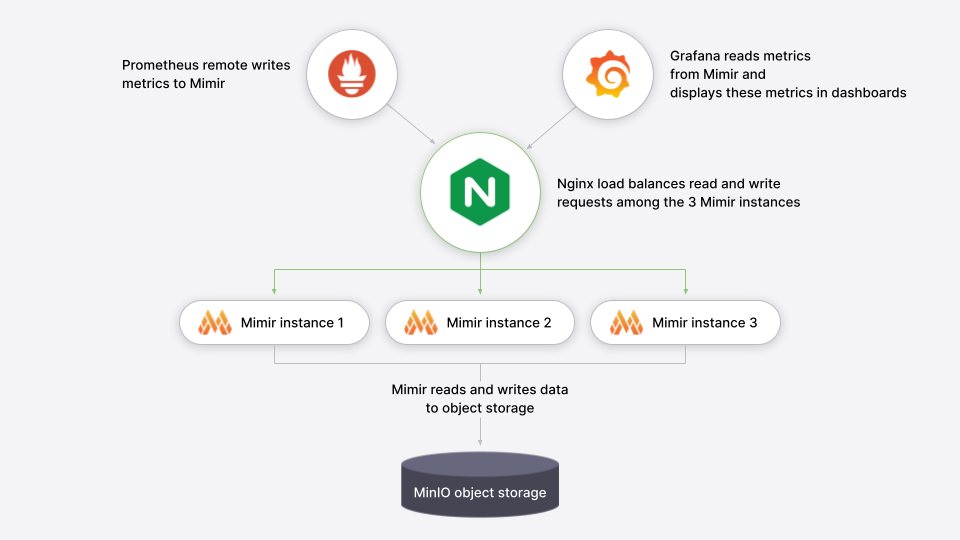
Mimir is responsible for storing and querying metrics data. Setting up Mimir involves configuring it to receive metrics from your applications and integrating it with Grafana for detailed analytics.
Steps:
- Install Mimir: Set up Mimir by following the installation instructions from the Mimir repository.
- Configure Metrics Collection: Use Prometheus or other metrics collectors to send data to Mimir.
- Visualize Metrics: In Grafana, create dashboards that display metrics data collected by Mimir.
6. Creating Comprehensive Dashboards
Once all components are set up, the next step is creating comprehensive dashboards in Grafana. These dashboards can combine logs, metrics, and traces to provide a holistic view of your system’s performance.
Steps:
- Design Layout: Plan the layout of your dashboards to ensure they are intuitive and informative.
- Add Panels: Use different types of panels (e.g., graphs, tables, single stats) to display various data points.
- Customize Queries: Tailor your queries to fetch the most relevant data for each panel.
- Share Dashboards: Make your dashboards accessible to team members and stakeholders.
7. Best Practices for Maintaining the LGTM Stack
Maintaining the LGTM stack involves regular updates, monitoring system performance, and ensuring data integrity. Follow best practices such as regular backups, performance tuning, and security assessments.
Best Practices:
- Regular Updates: Keep all components of the LGTM stack up to date with the latest releases.
- Performance Tuning: Optimize the performance of your stack by adjusting configurations and resource allocations.
- Security Measures: Implement security best practices to protect your data and infrastructure.
- Data Backup: Regularly back up your data to prevent loss in case of failures.
- Monitoring and Alerts: Continuously monitor the health of your stack and set up alerts for critical metrics.
Image Description: Checklist infographic with best practices for maintaining the LGTM stack.
8. Case Study: Implementing Grafana LGTM Stack at aiblux
To illustrate the power of the Grafana LGTM Stack, let’s look at a case study of how aiblux implemented this stack for a client.
Case Study:
- Client Background: A leading e-commerce company needing real-time monitoring of their system performance.
- Challenges: The client faced issues with log management, traceability of requests, and performance monitoring.
- Solution: aiblux implemented the Grafana LGTM Stack to address these challenges.
- Outcome: Enhanced visibility into system performance, faster issue resolution, and improved overall efficiency.
Conclusion
The Grafana LGTM Stack is a powerful toolset for efficient data monitoring and analysis. By integrating Loki, Grafana, Tempo, and Mimir, you can gain comprehensive insights into your system’s performance, ensuring optimal operation and quick issue resolution.
For more information or to explore how aiblux can assist in implementing the Grafana LGTM Stack for your business, contact us today.
